When one of the world’s most respected mints posts “mixed results,” serious investors and collectors pay attention.
The Perth Mint bullion sales figures for 2025 tell a nuanced story: gold demand strengthened year-over-year, silver cooled dramatically compared to prior highs, and both metals traded against a backdrop of extraordinary price rallies. For U.S. coin collectors, bullion investors, and industry professionals, these numbers offer critical insight into broader precious metals trends heading into 2026.
Let’s break down what happened — and more importantly, what it means.
Market Context: Soaring Precious Metals Prices in 2025
Before analyzing the sales data, it’s essential to understand the macro backdrop.
According to LBMA pricing (USD):
- Gold rose 65% in 2025
- Silver surged 149.1% in 2025
- December alone saw gains of:
- Gold: +2.8%
- Silver: +33.5%
These are extraordinary annual increases by historical standards. For comparison, gold’s long-term average annual return is roughly 8–10%, while silver is historically more volatile but rarely posts triple-digit percentage gains.
In such environments, investor behavior often shifts:
- Some buy aggressively, chasing momentum.
- Others take profits.
- Institutional buyers rebalance.
- Retail investors hesitate at perceived “high” prices.
This dynamic played out clearly in Perth Mint gold bullion sales and Perth Mint silver bullion sales.
Perth Mint Silver Bullion Sales: Demand Cools After Historic Highs
December 2025 Silver Sales
- 597,873 ounces
- Down 31.7% from November
- Down 43.5% year-over-year
Neil Vance, General Manager of Minted Products at The Perth Mint, noted:
“December is traditionally a quieter period for precious metals as customers turn their attention to the holiday and festive season.”
Seasonality absolutely plays a role. December is historically softer across global mints. However, the broader annual trend is more telling.
Full-Year 2025 Silver Bullion Sales
- 7,285,537 ounces total
Year-over-year comparisons show significant contraction:
| Year | Silver Sales (oz) | % Change vs 2025 |
|---|---|---|
| 2024 | 9.81M | -25.8% |
| 2023 | 14.89M | -51.1% |
| 2022 | 23.17M | -68.6% |
| 2021 | 19.09M | -61.8% |
From the 2022 peak of over 23 million ounces to just 7.28 million in 2025, sales have fallen more than 68%.
Why Did Silver Sales Fall Despite a 149% Price Rally?
This is where experience in bullion markets matters.
Possible drivers:
- Profit-taking: Early buyers in 2022–2023 likely locked in gains.
- Sticker shock: Retail investors often hesitate when prices surge rapidly.
- Capital rotation: Some investors shifted into gold for stability.
- Inventory normalization: Pandemic-era silver demand (2020–2022) was abnormally high.
It’s important to note that declining physical sales during rising prices does not necessarily mean weak demand. It often reflects market maturity and investor repositioning.
Perth Mint Gold Bullion Sales: A Rebound Story
December 2025 Gold Sales
- 35,885 ounces
- Down 46.2% from November
- Up 13.1% year-over-year
The month-over-month decline reflects typical year-end behavior. The year-over-year gain is more instructive.
Full-Year 2025 Gold Bullion Sales
- 465,856 ounces
- 19% higher than 2024
- Still below 2023 and pandemic-era peaks
Gold’s performance contrasts sharply with silver.
Why Gold Outperformed in Sales Terms
Even with a 65% annual price increase, gold sales rose year-over-year. This suggests:
- Continued safe-haven demand
- Strong interest in minted gold bars
- Institutional and high-net-worth participation
As Vance noted:
“Minted bars performed strongly, reinforcing their ongoing appeal as a core investment choice during periods of market volatility.”
Gold’s role as a portfolio stabilizer likely drove consistent buying even at elevated prices.
Comparing Gold vs Silver: 2025 Snapshot
| Metric | Gold | Silver |
|---|---|---|
| 2025 Price Increase | +65% | +149.1% |
| 2025 Sales Trend | Up 19% YoY | Down 25.8% YoY |
| Volatility | Lower | Higher |
| Investor Base | Institutional + Retail | Primarily Retail |
For U.S. bullion investors, this reinforces a classic lesson: gold behaves differently than silver during strong bull cycles.
Australian Bullion Coins Driving Demand
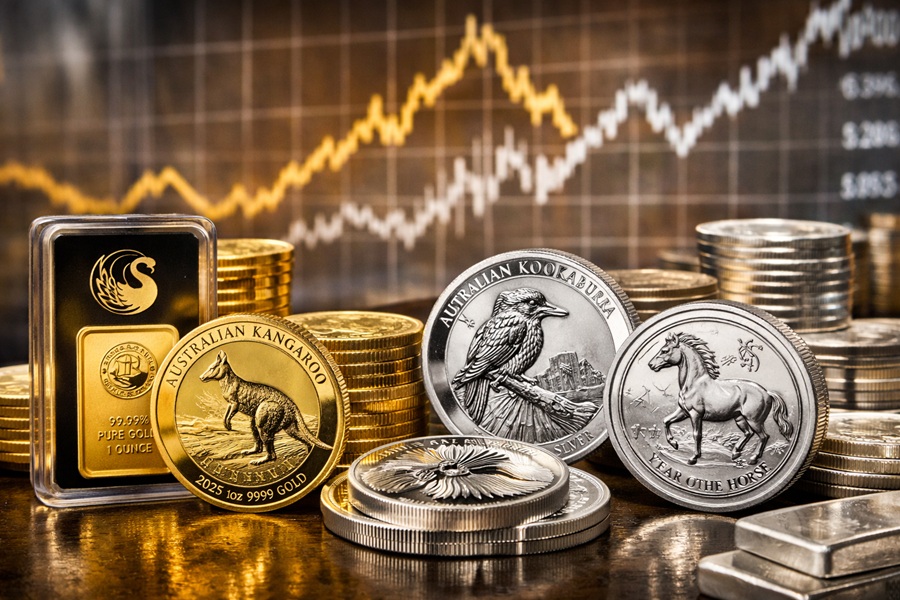
The Perth Mint remains globally recognized for its Australian bullion coins, especially:
- Australian Kangaroo
- Lunar Series III (Year of the Snake, Year of the Horse)
- Australian Kookaburra
- Australian Koala
- Australian Swan
- Wedge-tailed Eagle
- Emu series
Notable 2025 releases included:
- Lunar Series III 2026 Year of the Horse (gold, silver, platinum)
- Kangaroo 2026 bullion series
- Dragon and Snake privy issues
- 225th Anniversary Pillar Dollar commemoratives
For collectors in the U.S., Lunar Series and Kangaroo coins remain particularly liquid in the secondary market.
Case Study: Lunar Series Impact
The Lunar Series III program continues to generate strong global demand due to:
- Limited mintages
- International recognition
- Strong performance in prior cycles
However, bullion-oriented buyers tend to focus more on:
- Premiums over spot
- Availability
- Secondary liquidity
As prices rise sharply, premium compression often occurs — benefiting large-volume buyers.
What This Means for U.S. Coin Collectors and Investors
Although The Perth Mint operates in Australia, its bullion products are widely distributed through U.S. dealers.
Key Takeaways:
1. Gold’s Structural Strength Continues
Rising prices + rising sales = strong underlying conviction.
For portfolio allocation, gold continues to serve as:
- Inflation hedge
- Currency hedge
- Geopolitical insurance
2. Silver Remains Volatile and Cyclical
Silver’s massive price rally likely contributed to lower physical demand.
Investors should understand:
- Silver moves faster in both directions.
- Retail participation is more sentiment-driven.
3. Premiums Matter More in High-Price Environments
When spot prices surge:
- Some mints experience supply tightness.
- Premiums can widen or compress.
- Secondary market spreads shift.
Monitoring Perth Mint bullion sales data provides insight into global supply-demand trends that can affect U.S. retail pricing.
Risks and Considerations for Precious Metals Investors
Balanced analysis requires discussing risks.
Potential Risks in 2026:
- Price corrections after extreme rallies
- Reduced retail participation
- Currency stabilization reducing safe-haven demand
- Increased mining output
Potential Bullish Catalysts:
- Continued geopolitical instability
- Central bank accumulation
- Inflation persistence
- Weakening U.S. dollar
Historically, physical bullion demand tends to strengthen during prolonged macro uncertainty.
Monthly Sales Trends: A Broader Perspective
Looking at 2022–2025 monthly data reveals:
- Silver peaked in 2022 during global uncertainty.
- Gold peaked during inflation and rate volatility cycles.
- Both metals show strong reaction to macro headlines.
For professionals in the coin industry, these cycles influence:
- Inventory strategy
- Pricing models
- Hedging activity
- Customer acquisition timing
TL;DR Summary
- Perth Mint bullion sales in 2025 were mixed.
- Gold sales rose 19% year-over-year.
- Silver sales fell 25.8% year-over-year.
- Gold rose 65% in price; silver surged 149%.
- Investor behavior shifted toward gold stability over silver volatility.
- 2026 outlook depends on macroeconomic stability and inflation trends.
Frequently Asked Questions
1. Why did silver sales drop if prices surged?
Sharp price increases often lead to profit-taking and reduced retail buying at perceived highs.
2. Are Perth Mint bullion coins popular in the U.S.?
Yes. Kangaroo, Lunar, and Kookaburra coins are widely traded through major U.S. bullion dealers.
3. Is gold a safer investment than silver?
Gold is generally less volatile and favored for wealth preservation. Silver offers higher upside potential but greater price swings.
4. Do declining bullion sales signal a bear market?
Not necessarily. Sales data reflects physical demand, not total market activity (which includes ETFs and futures).
Conclusion: Reading Between the Lines of Perth Mint Bullion Sales
The 2025 Perth Mint bullion sales figures illustrate a classic precious metals cycle.
Gold demonstrated resilience, supported by its role as a global monetary hedge. Silver, despite explosive price gains, saw softer physical demand — a reminder that investor psychology often shifts after major rallies.