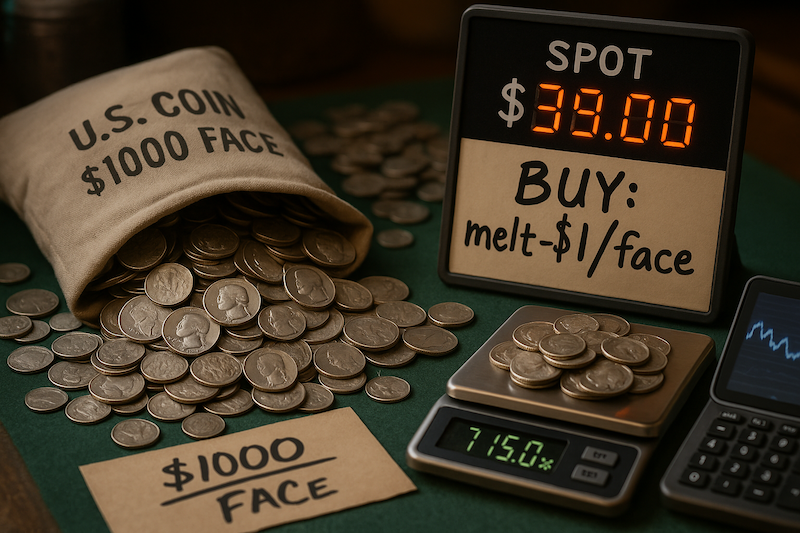
Hook: When spot silver grazed the $39/oz line this summer, phones lit up and junk silver sell-off orders swamped show floors and refiner desks. Within days, buy prices on pre-1965 90% U.S. coinage (the classic “junk silver”) swung from healthy premiums to discounts below melt—a reminder that timing and spreads can matter as much as spot.
TL;DR for busy readers: Silver’s run toward $39/oz (late July) and subsequent pullbacks triggered a wave of selling in $1,000 face-value bags. Some refiners reportedly quoted buy levels under melt during the surge, while a shrinking pool of end-buyers pressured dealer bids. Know your math (0.715 oz Ag per $1 face), track spot with credible sources, and manage the premium/discount cycle rather than chasing price alone.
Why this matters now: context from the tape and the bourse
Silver’s 2025 rally pushed intraday highs toward the upper-$39s in late July before easing back into the high-$30s in August. Mainstream market desks noted silver near $38.0–$38.5 in late August trade, underscoring both momentum and volatility.
That kind of move is historically important. The last major upside blow-off was in 2011, when silver flirted with $49–$50/oz before a sharp reversal. Premiums and buy-backs on 90% coinage whipsawed then, too—a useful analog for today’s action.
On the ground, coin-show anecdotes match the tape: as silver spiked, sellers flooded booths with $1,000 face-value bags. With more material than immediate retail demand, refiners lowered bids, dealers reduced what they paid the public, and spreads widened quickly—classic supply-demand mechanics in a thin, sentiment-driven segment.
“Spot is the headline, but spreads are the story,” as one wholesale buyer likes to say. “When everyone sells the same thing at once, the market pays you for liquidity, not melt.” (Paraphrased industry commentary.)
Junk silver basics (and the math you must know)
- What is “junk silver”? Common, circulated pre-1965 U.S. dimes, quarters, and half dollars struck in 90% silver/10% copper and valued primarily for melt, not rarity.
- Silver content: In trade, a conservative rule of thumb is 0.715 troy oz of silver per $1 face value (vs. the theoretical 0.7234 oz uncirculated), accounting for circulation wear. That implies 715 troy oz in a standard $1,000 face-value bag.
- Melt calculation: Melt per $1 face = Spot × 0.715. At $39, that’s ≈ $27.89 per $1 face; a full bag’s melt ≈ $27,885. (Illustrative math; dealer quotes vary.)
Why premiums and discounts swing so hard
- Retail demand vs. wholesale flow: When retail stacker demand is hot (e.g., shortages), 90% coins can command large premiums over melt—as seen in 2020, when premiums ballooned alongside supply disruptions. In slow lanes or selling spikes, bids can sink below melt.
- Processing friction: Refiners face assay, sorting, logistics, and hedge costs; they price that risk, especially when intake surges.
- Dealer balance sheets: If everyone is selling and few are buying, dealers lower bids to avoid inventory risk.
What the $39 spike did to the junk silver sell-off (with numbers)
The table below shows indicative melts for $1 face and a $1,000 bag at different spot prices, plus a hypothetical “melt minus $1 per $1 face” buy level sometimes heard during surges. (Example only; actual bids vary by firm and day.)
| Spot silver (per oz) | Melt per $1 face (0.715×spot) | $1,000 bag melt (715 oz) | If buyer quotes melt − $1 per $1 face → payout per $1 face | Bag payout at melt − $1/face |
|---|---|---|---|---|
| $39.00 | $27.89 | $27,885 | $26.89 | $26,885 |
| $38.00 | $27.17 | $27,170 | $26.17 | $26,170 |
| $35.00 | $25.03 | $25,025 | $24.03 | $24,025 |
| $32.00 | $22.88 | $22,880 | $21.88 | $21,880 |
| $30.00 | $21.45 | $21,450 | $20.45 | $20,450 |
Takeaway: A strong spot can still coincide with below-melt buy levels if supply overwhelms immediate demand. Knowing both melt and the premium/discount keeps you from mistaking a headline spot number for the actual check you’ll receive.
To track spot credibly, use LBMA benchmark data and established price desks; for the 2025 run to ~$39, see Kitco (mid-July resistance near $39) and price history pages showing the July 23 high. For late-August quotes near $38, mainstream wire services reported spot daily.
The market’s two memories: 2011 and 2020
- 2011 peak (near $49.50): Silver’s blow-off top was followed by a rapid unwind; many who sold 90% silver into the strength did better than those who waited for even higher prices. The lesson is discipline, not doom: rallies can reverse fast.
- 2020 shortage/premium surge: Physical coin and bar supply lagged demand, and premiums (including on junk silver) spiked far above melt. The market can move both ways—today’s discount can become tomorrow’s premium if retail demand suddenly returns.
“Premium cycles live on different timelines than spot,” a wholesale trading desk told me. “Tight supply pushes premiums up even when spot is flat; gluts push them down even when spot is up.” (Paraphrased.)
Pros and cons of selling (or buying) junk silver into a spike
Pros
- Liquidity: $1 face units sell easily; bags are a known standard (715 oz).
- Tight math: The 0.715 convention simplifies quick valuations and hedging.
- Potential over-melt bids in shortage windows (e.g., 2020 premiums).
Cons / Risks
- Spread risk: In selling waves, bids can slip below melt despite strong spot.
- Timing risk: Short rallies may fade before you can ship, grade, or negotiate.
- Opportunity cost: “All-out” selling in a spike can leave you underweight if a longer bull trend develops.
A practical playbook for collectors, dealers, and investors
1) Anchor to data, not noise
- Spot price: Use live charts from established desks and daily LBMA benchmarks.
- Context: Note that silver touched ~$39 in July 2025; late-August levels hovered around $38. Frame your decision against that range.
2) Know your melt math
- For quick quotes, keep 0.715 oz per $1 face top of mind (i.e., $27.89 per $1 face at $39 spot). If a buyer quotes “melt minus $X per face,” translate it to dollars on a bag.
3) Shop the spread
- Call at least three outlets (local dealer, national bullion house, refiner’s buying desk). Ask for:
- Bid per $1 face today, and whether it’s fixed on receipt or floats with spot.
- Fees (assay, shipping, wire) and min/max bag sizes.
- Settlement speed and hedge policy.
4) Decide inventory lanes
- Long-term stackers: Consider selling only excess bags into spikes; keep a core position.
- Dealers: Hedge incoming bags (futures/forwards) to avoid being forced to cut bids aggressively.
- Show walkers/day-traders: Plan exit prices before you hit the floor; volatility punishes indecision.
5) Mind taxes, documentation, and security
- Track cost basis and proceeds; consult a tax professional (capital gains/loss rules apply).
- Ship insured; photograph seals/contents; use carriers experienced with bullion.
Case study: a one-week flip
Imagine you received two quotes a week apart around the July spike:
- Week A (hot spike): Buyer quotes melt − $1 per $1 face; spot $39 → payout ≈ $26,885 for a $1,000 bag.
- Week B (cooling): Another buyer quotes melt − $0.10 per $1 face; spot $38 → payout ≈ $27,070.
Result: Even with lower spot, the tighter spread in Week B pays ~$185 more. Lesson: the spread can trump the spotin real-world checks.
Balanced perspectives for each audience
Coin collectors in the U.S. / general audience
- If you love history and low-denomination silver, keep some 90% as a permanent type set. Don’t let a headline spike strip your collection to zero.
Coin industry professionals
- Use transparent bid matrices tied to spot and supply conditions; publish them to build trust.
- Educate sellers with the 0.715 convention and the reasons bids can drift under melt when supply surges.
Coin investors
- Treat junk silver as a spread strategy, not just a spot bet. Size positions so you can patiently wait for favorable premiums.
- Remember the 2011 and 2020 lessons: premiums can collapse or explode independent of spot.
Frequently asked questions (FAQ)
What exactly is in a “$1,000 face-value” bag?
Typically a mixed lot of circulated pre-1965 dimes/quarters/halves. For valuation, dealers assume 715 troy oz of silver per bag.
Why does everyone use 0.715 oz per $1 face instead of 0.7234 oz?
Theoretical ASW is 0.7234 oz brand-new; 0.715 accounts for typical wear in circulated coins and has become the trade standard.
Where can I verify silver’s recent run to ~$39?
See Kitco’s July coverage of resistance near $39 and historical pages that log a July 23 high around $39.3; late-August levels in the $38s were reported by major newswires.
How do premiums behave over time?
They expand when physical supply tightens (e.g., 2020), and compress—or flip to discounts—when supply floods in, even if spot is elevated.
Is junk silver still worth stacking?
Yes—if you buy on favorable spreads, not just favorable spot. Its divisibility and recognition keep it liquid; just avoid overpaying when premiums spike.
Bottom line and call-to-action
The junk silver sell-off of mid-2025 proves a simple but costly truth: spot is not your payout. In surge conditions, refiner and dealer bids can fall below melt even as silver prints eye-catching highs. If you’re considering a sale:
- Run the math (0.715 × spot).
- Shop three bids and compare net proceeds after fees.
- Time the spread, not just the chart.
If you’re buying, prioritize tight-spread inventory over chasing the last dime of spot. Either way, let data and discipline—not adrenaline—drive the trade.
Related Articles
- Why Premiums on Pre-1934 U.S. Gold Coins Are So Low — and What It Means for Collectors and Investors
- Perth Mint Bullion Sales 2025: What Mixed Results Mean for Gold and Silver Investors
- Engelhard Brand Revival: What the 2025 Relaunch Means for Collectors, Dealers, and Investors
- The Goldmine Strategy: How Elite Bullion Traders Built Fortunes in the Gold Market